
Learn how to measure website speed from the Linux terminal with curl, wget, ab, wrk and Lighthouse CLI. Check TTFB, load time and performance under load.
Introduction
Website speed is no longer a nice-to-have. Slow pages lose visitors, convert worse and rank lower in search results. Most people check speed with browser-based tools such as PageSpeed Insights or GTmetrix, but there is a faster, scriptable and often more precise option already sitting on your server: the Linux command line.
What is command-line speed testing?
Command-line speed testing means measuring how quickly a website responds using terminal tools instead of a browser. Tools like curl, wget, ab and wrk send real HTTP requests and report exact timings: how long DNS resolution took, how long the TLS handshake lasted, when the first byte arrived (TTFB) and when the full response finished. Some tools go further and simulate hundreds of users at once, or run a full browser audit in headless mode.
When would you use it?
- After a deployment, to confirm a new release did not slow down the site.
- When debugging a slow page, to find out whether the delay comes from DNS, the network, TLS or the application itself.
- Before a traffic spike, such as a product launch or a sale, to check how the server behaves under load.
- For ongoing monitoring, by running a script from cron and logging response times every few minutes.
- On remote servers without a GUI, where opening a browser is not an option.
Who is it for?
These techniques are aimed at system administrators, DevOps and SRE engineers, backend and web developers, and technical SEO specialists. You do not need to be a Linux expert: if you can open a terminal and paste a command, you can follow this guide. Site owners who manage their own VPS will also find it a quick way to check performance without third-party services.
A real-world example
Imagine an online store that suddenly feels sluggish after a plugin update. The browser test only says "page loads in 4.2 seconds," which does not tell you why. Running a single curl command from the server shows DNS and connection times are fine, but the time to first byte jumps from 180 ms to 2.9 seconds. That points straight at the backend, not the network or the front end. A quick load test with ab then confirms that response times grow sharply above 20 concurrent users. In ten minutes, you have narrowed the problem to one slow database query introduced by the plugin.
That is the power of the command line: precise numbers, repeatable tests and results you can automate. Let's look at the tools.
Measuring site speed: command-line approaches
Each tool below answers a different question. Start with curl to see where the time goes on a single request, then move to load-testing tools to see how the site holds up under traffic, and finish with Lighthouse for a full, browser-like view.
Replace https://example.com with your own URL in every example.
# with basic auth
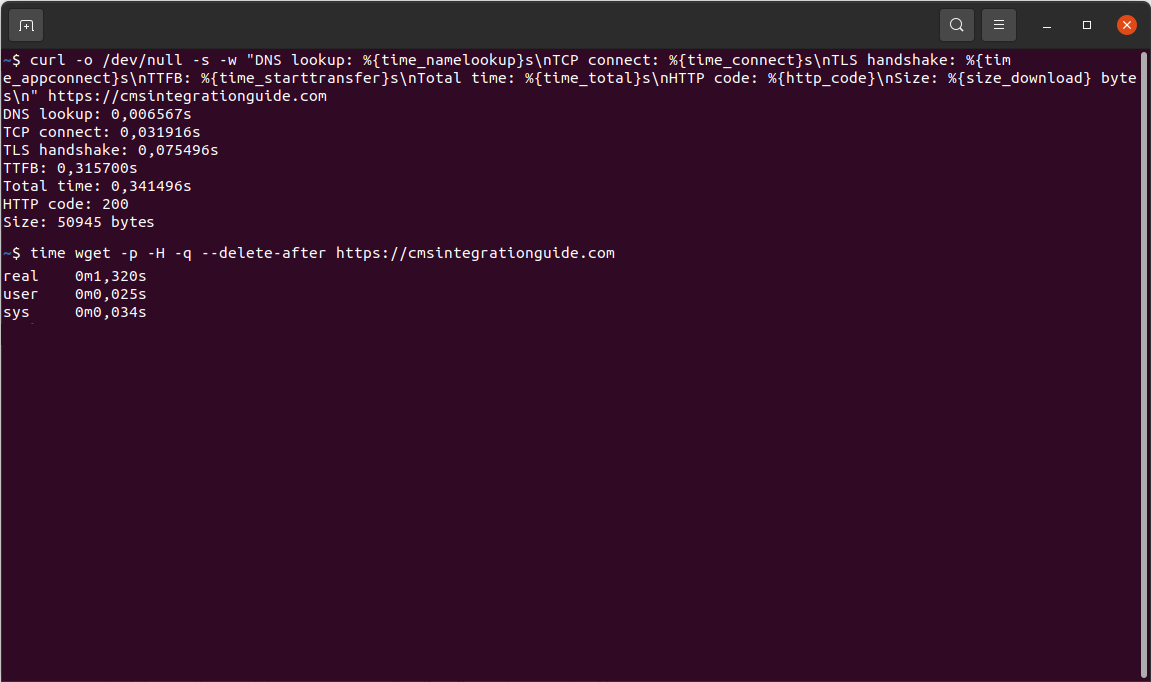
curl -o /dev/null -s -w -u user:pass "DNS lookup: %{time_namelookup}s\nTCP connect: %{time_connect}s\nTLS handshake: %{time_appconnect}s\nTTFB: %{time_starttransfer}s\nTotal time: %{time_total}s\nHTTP code: %{http_code}\nSize: %{size_download} bytes\n" https://example.com
curl is installed on almost every Linux system, and its -w (write-out) option prints detailed timings for each phase of a request. This is the single most useful command for diagnosing slow responses.
Example output:
DNS lookup: 0.012s
TCP connect: 0.031s
TLS handshake: 0.089s
TTFB: 0.214s
Total time: 0.236s
HTTP code: 200
Size: 48213 bytes
How to read it: the timings are cumulative from the start of the request. Subtract each value from the next to get the time spent in each phase. In the example, the server took about 125 ms (0.214 − 0.089) to generate the page after the connection was ready.
Use cases:
• High DNS time points to a slow DNS provider or missing caching.
• High TLS time can mean a missing session resumption, a long certificate chain or a distant server.
• High TTFB with fast connect times means the backend is slow: database queries, uncached pages or heavy application code.
curl -o /dev/null -s -w "%{time_starttransfer} %{time_total}\n" https://example.com
done | awk '{ttfb+=$1; total+=$2} END {printf "Avg TTFB: %.3fs Avg total: %.3fs\n", ttfb/NR, total/NR}'
One request can be misleading: caches warm up, networks fluctuate. Run the same request several times and average the results for a more reliable number.
Use cases:
• Comparing performance before and after a change, such as enabling a cache or a CDN.
• Simple monitoring: run it from cron every five minutes and append the output, with a timestamp, to a log file.
• Comparing cold and warm cache behaviour: the first request is often much slower than the rest.
#pip install httpstat # or: sudo apt install httpstat (on some distributions)
httpstat https://example.com
httpstat is a small wrapper around curl that draws the request phases as a readable timeline in your terminal. It is ideal when you want to show results to colleagues or clients.
The output shows the response headers followed by a bar of phases, DNS Lookup, TCP Connection, TLS Handshake, Server Processing and Content Transfer, each with its time in milliseconds.
Use cases: quick visual diagnosis, screenshots for reports or tickets, and teaching junior team members how an HTTP request is structured.
# with basic auth
time wget -p -H -q --delete-after --user=YOUR_USERNAME --password='YOUR_PASSWORD' https://example.com
CURL measures only the HTML document. Real visitors also download CSS, JavaScript, images and fonts. wget can fetch the page together with its required assets, which gives a rough idea of the full page weight and download time.wget params
-p downloads all page requisites (images, CSS, scripts).
-H allows assets hosted on other domains, such as a CDN.
-q keeps the output quiet, and --delete-after removes the files when finished.
The real value printed by time is the total wall-clock time.
Use cases: spotting heavy pages, checking the effect of image optimisation or minification, and confirming that assets on a CDN load quickly. Note that wget does not execute JavaScript and downloads files one after another, so treat the result as a relative comparison rather than the real browser load time.
#sudo apt install apache2-utils
ab -n 1000 -c 50 https://example.com/
ApacheBench sends many requests in parallel and reports how the server copes. It is part of the apache2-utils package on Debian and Ubuntu, and httpd-tools on RHEL, Rocky and Fedora.
The key lines in the output are Requests per second, Time per request and the percentile table at the end (50%, 90%, 99%), which shows how slow the slowest requests were.
ab params:
-n 1000 sends 1,000 requests in total.
-c 50 keeps 50 requests running at the same time.
The trailing slash in the URL is required.
Use cases: checking how many requests per second a page can handle, comparing server configurations (for example PHP-FPM settings or caching on and off) and finding the concurrency level at which response times start to climb.
#npm install -g lighthouse
lighthouse https://example.com \
--only-categories=performance \
--chrome-flags="--headless" \
--output=json --output-path=./report.json
When you need the metrics Google uses for Core Web Vitals, such as Largest Contentful Paint (LCP) and Cumulative Layout Shift (CLS), run Google Lighthouse in headless Chrome directly from the command line. It requires Node.js and Chrome or Chromium.
You can then pull out individual metrics with jq:jq '.categories.performance.score * 100' report.jsonjq -r '.audits["largest-contentful-paint"].displayValue' report.jsonjq -r '.audits["total-blocking-time"].displayValue' report.json
Add --preset=desktop to test the desktop experience; mobile is the default. Use --output=html for a shareable visual report.
Use cases: SEO and Core Web Vitals checks, automated performance budgets in CI/CD pipelines (fail a build if the score drops below a threshold) and tracking front-end performance over time.
Summary and key takeaways
You do not need a browser or a paid service to understand how fast your website is. A handful of Linux command-line tools can tell you where the time goes, how your server behaves under pressure and how real users experience your pages. Because they run in a terminal, every test can be repeated, scripted and automated.
A practical workflow looks like this: use curl to find which phase of the request is slow, use a curl loop to get stable averages, load test with ab, wrk or hey to find your limits, and run Lighthouse CLI to check Core Web Vitals before you ship.
Key takeaways:
- Start with curl -w. It is installed almost everywhere and shows DNS, connection, TLS and TTFB timings in one command.
- Never trust a single measurement. Run tests several times and compare averages and percentiles, not one-off numbers.
- TTFB tells you about the server; total load time tells you about the page. Fix backend issues first, then optimise assets.
- Load test before traffic arrives, not after. ab is fine for quick checks; wrk and hey are better for serious stress tests.
- Use Lighthouse CLI for SEO-relevant metrics such as LCP and CLS, and add it to your CI/CD pipeline to catch regressions automatically.
- Test responsibly. Only load test servers you own or have permission to test, and prefer a staging environment.
- Automate it. A simple cron job that logs response times every few minutes will warn you about slowdowns before your visitors notice.
Pick one command from this guide, run it against your site today and save the result. That baseline is the first step to a faster website.