
Introduction
Memcached is a high-performance, distributed memory object caching system often used to speed up dynamic web applications by alleviating database load.
While it's designed for efficiency, performance issues can still arise. When an application slows down, and Memcached is part of the stack, it's crucial to determine if the caching layer is the bottleneck. Fortunately, Memcached provides a powerful, built-in mechanism for real-time monitoring: the status commands.
By connecting directly to the Memcached server and issuing commands like stats, developers and system administrators can quickly identify operational issues and performance bottlenecks.
Prerequisites
To follow this tutorial, you will need:
Ubuntu 22.04, 20.04, 18.04 or older server with a sudo non-root user.
Installed Memcached service.
Identifying Bottlenecks with Memcached Status Commands
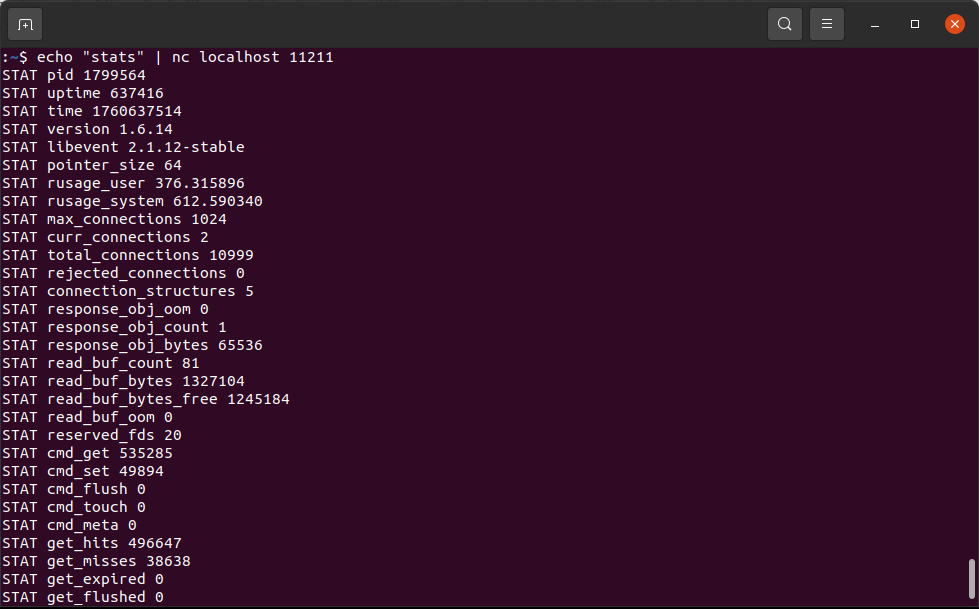
To troubleshoot Memcached, you typically connect to the server via telnet or nc on its listening port (usually 11211) and issue specific stats commands. Analyzing the output of these commands is the key to pinpointing the source of a performance drain.
The Core Command: stats
The basic stats command provides a comprehensive overview of the Memcached server's operational state. Key metrics to focus on include:
- cmd_get
The number of retrieval requests
ndicates general usage.
- get_hits
The number of successful retrievals (cache hits)
A high number is good; the cache is working.
- get_misses
The number of failed retrievals (cache misses)
High get_misses suggest a poor hit ratio. This is a major bottleneck, as requests are falling through to the slower backend (e.g., database).
- bytes_read / bytes_written
Total bytes transferred for commands and responses.
Helps gauge network traffic load on the Memcached server.
- evictions
The number of times items have been evicted to make room for new ones.
High evictions mean the cache is memory-constrained. The LRU (Least Recently Used) algorithm is aggressively discarding data, causing future requests for evicted items to miss.
- limit_maxbytes
The maximum memory allocated for Memcached items.
Compare this to the current usage (bytes). If bytes is consistently near this limit and evictions are high, you need to allocate more memory.
- curr_connections / total_connections
Current and total number of connections.
High curr_connections may indicate application connection pooling issues or overwhelming connection demands.
The command to output Memcached service usage stats.
Calculate the Global hitrate
This is very critical value to sites performance
Hitrate is defined as: get_hits / (get_hits + get_misses).
The higher this value is, the more often your application is finding cache results instead of finding dead air. Watch that the value is both higher than what you expect, and watch to see if it changes with time or releases of your application.
A consistently low hit ratio (e.g., below 80-90%) is a clear sign that Memcached isn't effectively serving requests.
Recommendation:
Increase Cache Time: Check the application logic to ensure frequently accessed data is cached for a sufficient duration.
Cache More Data: Review what the application is caching. If the essential data set is too large or too varied, consider scaling out Memcached instances or increasing allocated memory.
Increase used memory
Diagnosing Memory Pressure (The "Eviction" Problem)
If the evictions counter is rapidly increasing, it signifies that the cache is too small for the working data set. Every eviction essentially turns a future potential hit into a miss.
Recommendation:
Increase Memory: This is the most direct fix. Increase the amount of RAM allocated to the Memcached process.
Review Cache Keys: Ensure that overly large or non-critical data isn't unnecessarily consuming cache memory.
Advanced Insights: stats slabs and stats items
For deeper analysis, the stats slabs and stats items commands provide granular detail about memory allocation and item usage.
Recommendation
stats slabs: Shows how Memcached's memory is organized into slabs of different sizes. This helps identify if a particular slab class is running out of space and causing evictions, even if the overall memory usage isn't at the limit (a sign of slab fragmentation).
stats items: Provides information about the number of items currently stored, broken down by slab class, including the age of the oldest item. This is useful for confirming that data is expiring as expected.
Summary
Troubleshooting Memcached bottlenecks starts with the fundamental stats command. A system administrator should prioritize looking at two key areas: the hit ratio and evictions.
Low Hit Ratio (↓): Indication that the application isn't finding data, pointing to issues with cache expiration, key generation, or insufficient coverage of the required data set.
High Evictions (↑): Clear sign of memory contention, meaning the allocated cache size is too small for the application's demands.
By methodically analyzing the output of the status commands, developers can quickly move past speculation and apply targeted fixes, restoring Memcached to its role as a high-speed accelerator for the application stack.